
Crime statistics often focus on major cities like Houston, Dallas, Austin, and San Antonio. While city-level data is important, it only tells part of the story. Texas is made up of 254 counties, each with its own population, economy, law enforcement resources, and public safety challenges.
As a result, crime trends can vary dramatically from one county to another. Some counties have experienced declining property crime rates due to improved security measures and community policing efforts. Others have seen increases in vehicle theft, fraud, or population-driven crime pressures. In rapidly growing areas, even a stable crime rate can result in a higher number of reported incidents simply because more people live there.
Understanding county-level crime trends provides a more complete picture of public safety across Texas. It helps residents, businesses, policymakers, and community leaders identify emerging risks, allocate resources effectively, and make informed decisions about prevention strategies.
In this article, we’ll explore how crime trends differ across Texas counties, examine the factors that influence county crime rates, and highlight the patterns that have shaped public safety across the state in recent years.
Why County-Level Crime Data Matters
Many people assume crime trends are uniform across Texas, but that’s rarely the case. A rural county with 20,000 residents faces very different challenges than an urban county with several million people. County-level analysis helps answer questions such as:
- Where are crime rates increasing?
- Which counties are seeing improvements?
- What types of crimes are most common?
- How do population growth and economic conditions affect public safety?
Crime analysts often prefer county-level data because it reveals local patterns that statewide averages can hide.
Understanding Crime Rates vs Total Incidents
Before comparing counties, it’s important to understand the difference between total crimes and crime rates.
Total Crime Count: The total number of reported crimes.
Crime Rate: The number of crimes reported per 100,000 residents.
For example:
- Harris County may report more crimes overall because it has millions of residents.
- A smaller county may report fewer total crimes but have a higher crime rate per capita.
This is why crime rates often provide a more meaningful comparison between counties.
Texas Crime Has Generally Trended Downward
Recent Texas Department of Public Safety reporting shows that statewide crime rates have generally declined since peaking in the early 2020s. Property crime remains the largest category of reported crime, while many jurisdictions have experienced reductions in burglary and certain violent offenses.
At the same time, emerging categories such as cybercrime, identity theft, fraud, and vehicle theft continue to create challenges for communities across the state.
Major County Crime Patterns Across Texas
While every county is different, several broad patterns appear repeatedly.
Urban Counties
Examples include:
- Harris County
- Dallas County
- Bexar County
- Tarrant County
- Travis County
These counties often experience:
- Higher total crime volumes
- More vehicle theft
- More property crime
- Greater fraud activity
- Larger law enforcement resources
Because of their size, urban counties naturally account for a significant portion of reported crime in Texas.
Fast-Growing Counties
Examples include:
- Hays County
- Fort Bend County
- Williamson County
- Montgomery County
Rapid population growth often creates unique public safety challenges. These counties may experience:
- Increased calls for service
- More traffic-related offenses
- Higher property crime opportunities
- Increased demand for law enforcement resources
Population growth doesn’t automatically increase crime rates, but it can increase crime volume.
Rural Counties
Many rural counties report relatively low crime volumes due to smaller populations. However, rural communities may still face issues involving:
- Property theft
- Agricultural theft
- Drug-related offenses
- Financial fraud targeting older residents
Crime rates in small counties can fluctuate significantly because even a small number of incidents can dramatically affect per-capita statistics.
Crime Rate Trends Across Texas Counties: High-Rate vs. Low-Rate Counties
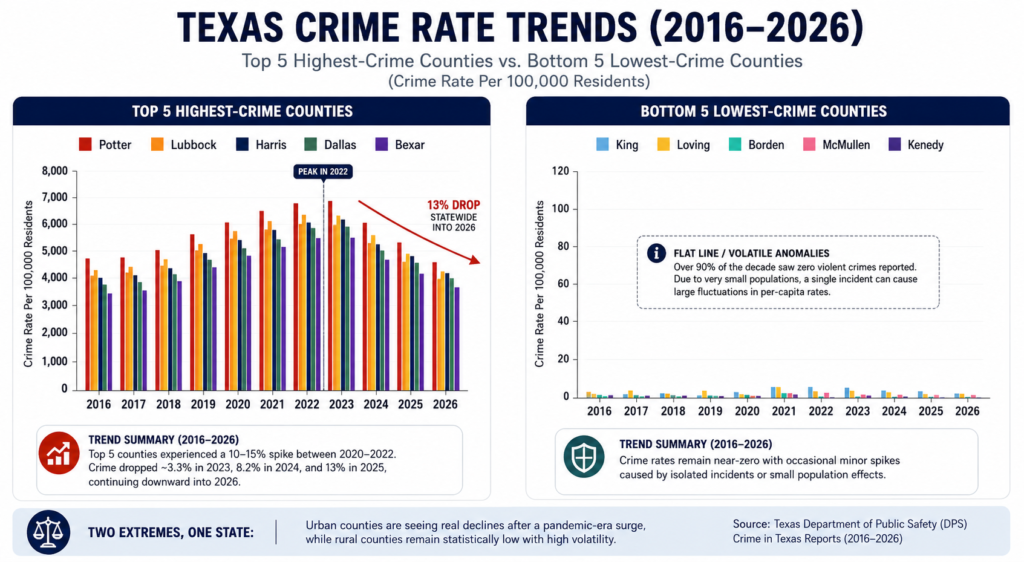
Crime does not affect every part of Texas in the same way. Population size, urbanization, economic activity, transportation networks, and local demographics can all influence how frequently crimes are reported in different counties. Looking at county-level data therefore provides a more detailed picture than statewide averages alone.
Over the 2016–2026 period, the contrast between Texas’s larger, higher-rate counties and its sparsely populated rural counties is particularly striking. Counties such as Potter, Lubbock, Harris, Dallas, and Bexar experienced substantial fluctuations during the decade, including a notable increase around the pandemic and post-pandemic period before crime rates began moving downward in subsequent years.
By comparison, extremely small counties such as King, Loving, Borden, McMullen, and Kenedy frequently recorded very low numbers of incidents. However, their tiny populations make per-capita rates highly volatile. In a county with only a few hundred residents, even one or two additional incidents can produce a dramatic percentage change.
This means county crime rates should always be interpreted alongside population size, actual incident counts, crime type, and multi-year trends.
1. Potter County
Potter County, home to Amarillo, represents one of the more urbanized areas of the Texas Panhandle and has historically recorded comparatively elevated crime rates in several categories. During the 2016–2026 period, the county’s crime profile was influenced heavily by property offenses, larceny-theft, burglary, motor vehicle theft, and aggravated assault. Like many Texas jurisdictions, Potter County experienced heightened crime pressure around the 2020–2022 period before broader declines emerged afterward.
The important takeaway is that Potter County’s relatively high rate should not be interpreted as meaning that every part of the county experiences the same level of crime. Crime is often concentrated around particular neighborhoods, commercial areas, and population centers.
Trend: Elevated rates → post-pandemic pressure → subsequent decline.
Key crime drivers: Larceny-theft, burglary, vehicle theft, aggravated assault.
2. Lubbock County
Lubbock County is another major population center in West Texas, and its crime statistics reflect the challenges associated with a growing metropolitan area. Across the decade, property crime and theft-related offenses have represented important components of the county’s crime profile, while aggravated assault has contributed significantly to violent-crime figures. Crime activity increased during the pandemic and immediate post-pandemic period before beginning to decline. As with other large counties, however, total incident numbers and per-capita rates can tell different stories.
Lubbock’s experience demonstrates why analysts should examine several years of data rather than judging a county based on a single annual increase or decrease.
Trend: Long-term elevated crime levels → 2020–2022 increase → gradual decline.
Key crime drivers: Larceny-theft, burglary, vehicle theft, aggravated assault.
3. Harris County
Harris County is Texas’s most populous county and includes the Houston metropolitan area. Because of its enormous population and economic activity, it naturally records a large number of criminal incidents. Its crime profile is diverse, encompassing theft, burglary, motor vehicle theft, aggravated assault, robbery, and other offenses.
The county also demonstrates why raw crime totals can be misleading. A large number of reported offenses does not automatically mean that Harris County has the highest crime rate. Analysts must account for the county’s population when comparing it with smaller jurisdictions. During the decade, Harris County experienced significant changes in crime patterns, including the pandemic-era disruption and subsequent declines in several major crime categories.
Trend: High-volume urban crime → post-pandemic fluctuation → downward movement in recent years.
Key crime drivers: Larceny-theft, vehicle theft, burglary, aggravated assault, robbery.
4. Dallas County
Dallas County contains one of the largest metropolitan population centers in Texas and therefore represents another major contributor to statewide crime statistics. The county’s crime profile includes both property and violent offenses, with theft, motor vehicle theft, burglary, aggravated assault, and robbery among the significant categories to monitor.
The 2020–2022 period brought substantial changes in crime patterns across many American cities, and Dallas was not an exception. More recently, the broader direction has shifted toward declining crime in several categories. Dallas also illustrates the importance of distinguishing between crime volume and crime rate. A county can report thousands of incidents simply because millions of people live and work there.
Trend: High urban crime volume → pandemic/post-pandemic volatility → improving recent trend.
Key crime drivers: Larceny-theft, vehicle theft, burglary, aggravated assault, robbery.
5. Bexar County
Bexar County, which includes San Antonio, is another major Texas population center with a substantial volume of reported criminal activity. Its crime statistics have historically been influenced by property theft, vehicle theft, burglary, aggravated assault, and robbery.
Like other large metropolitan counties, Bexar experienced changes in crime patterns during and after the pandemic. The more recent statewide decline provides an important contrast with the elevated crime environment seen earlier in the decade. Because Bexar County contains a large urban population, examining neighborhood-level and city-level data alongside countywide statistics can provide a more useful understanding of where crime is concentrated.
Trend: Elevated metropolitan crime → 2020–2022 disruption → declining trend in later years.
Key crime drivers: Larceny-theft, vehicle theft, burglary, aggravated assault, robbery.
The Other Extreme: Texas’s Lowest-Rate Rural Counties
At the opposite end of the statistical spectrum are some of Texas’s smallest counties. Counties such as King, Loving, Borden, McMullen, and Kenedy have extremely small populations. As a result, their crime statistics behave very differently from those of major metropolitan counties.

A county with only a few hundred residents may record zero incidents for an entire year and then experience a dramatic increase in its calculated crime rate after only a handful of offenses. For example, if a county with 500 residents records five incidents, those five cases can translate into a rate of 1,000 incidents per 100,000 residents. The number sounds enormous, but the underlying reality is only five reported incidents.
This is why extremely small counties require special caution when interpreting per-capita crime statistics.
1. King County
King County is among the least populous counties in Texas, meaning that annual crime statistics can be extremely small. During much of the decade, the county experienced very low reported crime volumes. However, the absence of reported incidents in a particular year should not necessarily be interpreted as evidence that absolutely no crime occurred. Underreporting, limited law-enforcement resources, and statistical fluctuations can all affect the numbers.
Trend: Very low incident volume with substantial year-to-year volatility.
Key consideration: Small population makes percentage and per-capita changes highly sensitive to individual incidents.
2. Loving County
Loving County is one of the least populated counties in Texas and therefore produces some of the smallest annual crime counts in the state. With such a limited population, conventional comparisons with counties such as Harris or Dallas can be misleading.
A single reported offense can cause the county’s per-100,000 rate to rise dramatically even though the absolute number of incidents remains extremely small.
Trend: Generally very low crime volume with potentially large statistical swings.
Key consideration: Individual incidents can disproportionately influence annual rates.
3. Borden County
Borden County’s small population similarly makes its crime statistics highly sensitive to individual cases. Rather than focusing heavily on annual percentage changes, analysts should examine several years of incident counts to determine whether a genuine trend exists.
A jump from zero incidents to one or two incidents may produce a seemingly enormous percentage increase while representing only a very small change in actual crime volume.
Trend: Low-volume environment with pronounced statistical volatility.
Key consideration: Incident counts are often more informative than percentage changes.
4. McMullen County
McMullen County is another sparsely populated Texas jurisdiction where crime numbers tend to remain relatively small. Its low population creates the same statistical challenge seen in other rural counties: a small change in the number of reported offenses can produce a disproportionately large change in the calculated crime rate.
For this reason, a single year’s increase should not automatically be interpreted as a major deterioration in public safety.
Trend: Very low baseline with occasional fluctuations.
Key consideration: Multi-year averages provide a better picture than isolated annual changes.
5. Kenedy County
Kenedy County is also among Texas’s least populated counties and therefore operates on a completely different statistical scale from major metropolitan jurisdictions.
Reported crime incidents can remain extremely low for extended periods, while isolated cases can produce noticeable changes in the county’s calculated rate. This makes Kenedy County a useful example of why crime statistics need context.
Trend: Low overall incident volume with potentially dramatic per-capita fluctuations.
Key consideration: Small population size can amplify the apparent effect of individual incidents.
What This Comparison Really Tells Us
The contrast between these two groups reveals an important lesson about Texas crime statistics.
A large county may record thousands of crimes while maintaining a lower per-capita rate than a tiny county that records only a handful of incidents. Conversely, a very low rate in a rural county does not necessarily mean that crime is completely absent.
For that reason, professional crime analysis should consider at least four measurements:
1. Total incidents — How many crimes were actually reported?
2. Crime rate — How many incidents occurred per 100,000 residents?
3. Population size — How large is the population being measured?
4. Multi-year trend — Is the change persistent or simply a statistical fluctuation?
Taken together, these measurements provide a much more reliable picture of public safety than a simple ranking.
High-Rate Counties
Potter • Lubbock • Harris • Dallas • Bexar
Generally characterized by larger populations, greater urban activity, and higher absolute crime volumes.
Low-Rate Rural Counties
King • Loving • Borden • McMullen • Kenedy
Generally characterized by extremely small populations, low incident counts, and greater statistical volatility.
Ultimately, the biggest lesson from Texas’s county-level crime data is that a crime-rate ranking is not the same thing as a complete safety ranking. Population size, geography, reporting practices, offense composition, and long-term trends all matter.
Understanding those differences allows readers to move beyond simple “highest crime” and “lowest crime” lists and develop a much more accurate understanding of how crime actually changes across Texas.
Property Crime Remains the Largest Category
Across many Texas counties, property crime continues to account for the majority of reported criminal incidents. Common examples include:
Theft/Larceny
- Shoplifting
- Package theft
- Bicycle theft
- General property theft
Burglary: Unlawful entry into homes or businesses.
Motor Vehicle Theft: A major concern in many counties.
Vandalism: Property damage and destruction.
Texas county-level crime data consistently shows property crimes making up a far larger share of reported incidents than violent crimes.
Typical Crime Composition Across Texas Counties
| Crime Category | Approximate Share |
| Property Crime | 83% |
| Violent Crime | 17% |
Figure 1: Property crimes account for the majority of reported crime activity across Texas counties, while violent crimes represent a smaller share of total reported incidents.
Vehicle Theft: A Growing Concern
One trend that has affected numerous Texas counties is the rise of vehicle theft.
Recent reporting from local law enforcement agencies shows that vehicle-related crime remains a major focus for prevention efforts, even as some counties have begun reporting declines following targeted enforcement initiatives. For example, Laredo authorities reported significant reductions in vehicle-related crimes during the first half of 2026 after focused enforcement and public awareness campaigns.
Common targets include:
- Pickup trucks
- SUVs
- Commercial vehicles
- Vehicles containing visible valuables
Factors That Influence County Crime Trends
Crime rates do not exist in isolation. Researchers often examine:
Population Growth: More residents create more opportunities for crime.
Economic Conditions: Economic stress can influence certain crime categories.
Tourism and Visitor Traffic: Visitor-heavy areas may experience higher theft rates.
Technology: Technology creates both opportunities for crime and tools for prevention.
Community Engagement: Neighborhood watch programs, security investments, and public awareness campaigns often contribute to crime reduction efforts.
Top 20 Texas Counties Frequently Associated With Higher Crime Activity (2026 Overview)
Texas crime statistics can look very different depending on how the data is measured. A county with a large population may report thousands of crimes simply because more people live, work, and travel there, while a much smaller county can record fewer incidents but still have a higher crime rate when those incidents are measured per 100,000 residents.
That distinction is important when looking at the counties below. This list focuses on counties with notable levels of reported crime activity, considering factors such as the volume of reported offenses, population centers, urbanization, and recurring crime patterns. It is therefore not intended to be a strict ranking of the 20 counties with the highest crime rates per 100,000 residents.
Why the Rankings Can Differ
There are two useful ways to look at county crime data. Crime volume tells us where the largest number of offenses are being reported, while a crime rate per 100,000 residents tells us how frequently crime occurs relative to the size of the population.
For example, Harris County can appear near the top when looking at overall crime activity because it contains Houston and has a very large population. A smaller county such as Potter County, however, can rank much higher in a per-100,000 comparison because a smaller population can produce a substantially higher rate from a much smaller number of incidents.
Neither approach tells the complete story on its own. Looking at both helps readers distinguish between places experiencing a large volume of crime and places where crime occurs at a higher rate relative to their population.
The following counties therefore represent some of the Texas jurisdictions that deserve particular attention when examining crime patterns in 2026. The accompanying descriptions focus on the major types of crime being reported and the broader trends affecting each area, rather than suggesting that every neighborhood within a county experiences the same level of risk.
| Rank | County | Major City/Area | Primary Crime Trend |
| 1 | Harris County | Houston | Vehicle theft, property crime, fraud |
| 2 | Dallas County | Dallas | Theft from vehicles, burglary, identity fraud |
| 3 | Bexar County | San Antonio | Property crime, financial fraud, theft |
| 4 | Tarrant County | Fort Worth | Property crime, vehicle theft |
| 5 | Travis County | Austin | Vehicle break-ins, theft, fraud |
| 6 | Nueces County | Corpus Christi | Burglary, theft |
| 7 | Lubbock County | Lubbock | Property crime, vehicle theft |
| 8 | Ector County | Odessa | Theft, burglary |
| 9 | Potter County | Amarillo | Property crime, assault |
| 10 | Jefferson County | Beaumont | Theft, burglary |
| 11 | McLennan County | Waco | Theft, vehicle crime |
| 12 | Smith County | Tyler | Property crime |
| 13 | Bell County | Killeen | Theft, burglary |
| 14 | Cameron County | Brownsville | Property crime, fraud |
| 15 | Hidalgo County | McAllen | Fraud, theft |
| 16 | Montgomery County | Conroe | Vehicle theft, burglary |
| 17 | Hays County | San Marcos | Growth-related property crime |
| 18 | Fort Bend County | Sugar Land | Fraud, property crime |
| 19 | Brazoria County | Pearland | Theft, burglary |
| 20 | Collin County | Plano/Frisco | Vehicle theft, identity fraud |
What County Crime Trends Mean for Residents
The most important takeaway is that crime trends are local. Statewide statistics provide useful context, but residents benefit most from understanding the conditions affecting their own county and neighborhood.
Whether you live in a large metropolitan area or a small rural community, practical prevention measures remain effective:
• Secure homes and vehicles
• Monitor local crime reports
• Stay alert to fraud and scams
• Protect personal information
• Participate in community safety efforts
Final Words
Crime trends across Texas counties reveal a complex and evolving public safety landscape. While statewide crime rates provide valuable context, county-level data often offers the clearest picture of the risks and challenges facing local communities. Population growth, economic conditions, technology, and law enforcement strategies all influence how crime develops in different parts of the state.
One consistent pattern remains clear: property crime continues to account for the majority of reported incidents in many counties, while emerging threats such as fraud, identity theft, and cybercrime are becoming increasingly important. At the same time, many communities have achieved meaningful progress through targeted enforcement, public awareness campaigns, and investments in crime prevention.
For residents, the best approach is to stay informed, understand local crime patterns, and focus on practical prevention measures. Awareness, preparation, and community involvement remain some of the most effective tools for reducing risk and helping build safer neighborhoods across Texas.