Crime statistics are everywhere. News headlines cite crime rates, politicians reference crime trends, law enforcement agencies publish annual reports, and social media users frequently share crime-related numbers. Yet despite how often these statistics are discussed, many people struggle to understand what the numbers actually mean.
A city may report a rise in crime even though certain offenses are decreasing. One county may appear more dangerous than another despite having fewer total crimes. A headline might highlight a percentage increase that sounds alarming, even though the actual number of incidents remains relatively small.
Without proper context, crime statistics can be confusing, or even misleading. Understanding how crime data is collected, measured, and reported allows you to look beyond headlines and develop a clearer picture of what’s happening in your community. Whether you’re researching neighborhood safety, evaluating crime trends, or simply trying to become a more informed citizen, learning how to interpret crime statistics is an essential skill.
In this guide, we’ll break down the key concepts behind Texas crime statistics, explain how crime rates work, identify common mistakes people make when reading crime data, and show you how to analyze crime trends like a professional researcher.
Why Crime Statistics Matter
Crime statistics help communities understand:
- Public safety trends
- Changes in criminal activity
- Law enforcement priorities
- Emerging crime threats
- Areas that may require additional resources
Crime data also helps policymakers, researchers, journalists, and residents make informed decisions based on evidence rather than assumptions. However, statistics are only useful when properly understood.
Where Texas Crime Statistics Come From
Most official crime statistics in Texas originate from law enforcement agencies that report crime information to state and federal databases. Major sources include:

Texas Department of Public Safety (DPS)
The DPS publishes annual Crime in Texas reports that summarize statewide crime trends.
The FBI collects crime data from agencies across the country through the National Incident-Based Reporting System (NIBRS).
Texas Local Police Departments
Cities and counties often release their own crime reports and public safety dashboards.
Court and Criminal Justice Agencies
Additional data may come from prosecutors, courts, correctional facilities, and victim services organizations.
Together, these sources provide a comprehensive picture of crime across Texas.
The Difference Between Crime Counts and Crime Rates
One of the most important concepts to understand is the difference between a crime count and a crime rate.
Crime Count
A crime count is the total number of incidents reported. Example:
- City A reports 5,000 crimes.
- City B reports 500 crimes.
At first glance, City A appears much more dangerous, but in reality the population size matters.
Crime Rate
Crime rates adjust for population and are typically reported per 100,000 residents. Example:
| City | Population | Crimes | Crime Rate |
| City A | 1,000,000 | 5,000 | 500 |
| City B | 50,000 | 500 | 1,000 |
Although City A has more total crimes, City B actually has the higher crime rate. This is why professional analysts focus heavily on crime rates rather than raw totals.
Understanding Violent Crime vs Property Crime
Crime data is commonly grouped into two major categories.
Violent Crime: Violent crimes involve force or the threat of force against another person.
Examples include:
- Murder
- Robbery
- Aggravated assault
- Sexual assault
Property Crime: Property crimes involve theft or damage to property.
Examples include:
- Burglary
- Larceny-theft
- Motor vehicle theft
- Vandalism
Historically, property crimes occur much more frequently than violent crimes in Texas.
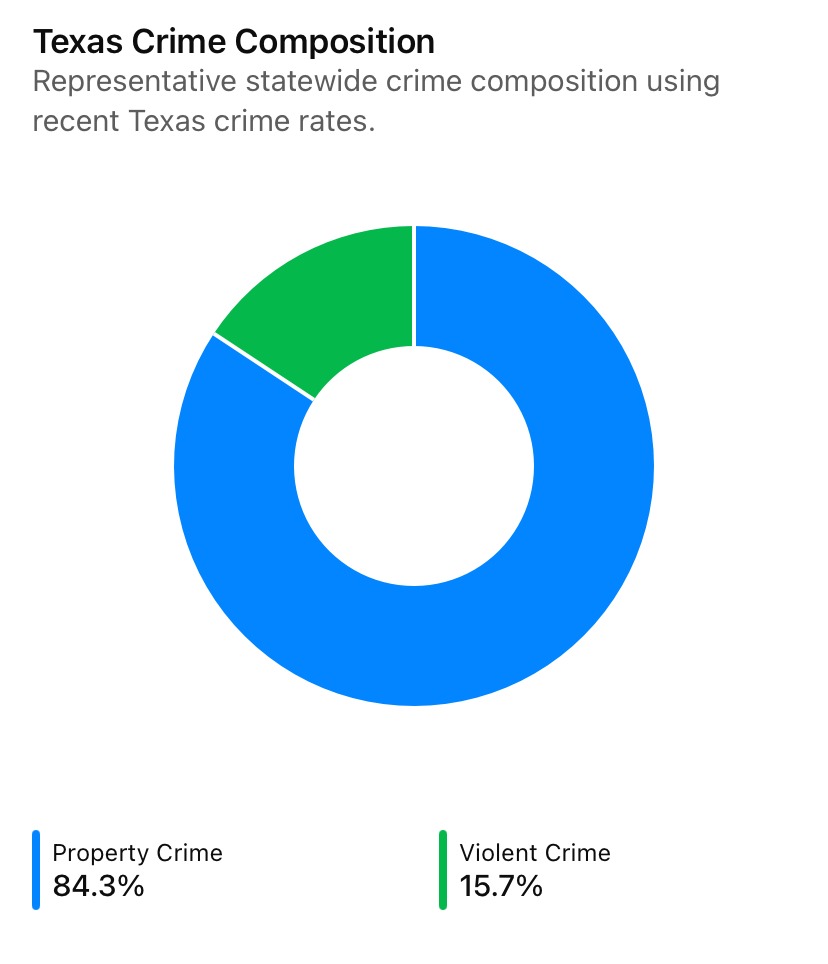
Source: Texas crime reporting data based on recent statewide violent and property crime rates per 100,000 residents.
What Does “Per 100,000 Residents” Mean?
You’ll frequently see crime rates expressed as: “389 violent crimes per 100,000 residents”
This standard measurement allows researchers to compare communities of different sizes. Rather than focusing on raw numbers, the rate estimates how often crime occurs relative to population size. This creates a fairer comparison between cities, counties, and states.
Why Crime Rates Sometimes Increase
A rise in crime statistics doesn’t always mean communities are becoming less safe. Several factors can influence reported crime rates.
Improved Reporting : More victims may be reporting crimes.
Population Growth : Larger populations naturally generate more incidents.
Changes in Data Collection : New reporting systems can increase recorded crime totals.
Greater Public Awareness : Certain crimes may be identified and reported more frequently.
For example, cybercrime reporting has increased significantly in recent years partly because more people recognize and report online scams.
How to Spot Misleading Crime Statistics
Crime numbers are often presented without context. Here are common mistakes to avoid.
Focusing Only on Percentages
A headline may report: Crime increased by 50%. That sounds alarming, however if incidents rose from 2 to 3 cases, the actual increase is relatively small. Always look at both percentages and raw numbers.
Ignoring Population Size
Cities with larger populations often report more crimes simply because more people live there. Crime rates provide a better comparison.
Looking at One Year in Isolation
Crime fluctuates naturally. Professionals typically analyze trends across:
- Five years
- Ten years
- Longer periods
Long-term trends often provide more meaningful insights than a single year’s data.
Understanding Crime Trends in Texas
Crime trends are patterns that emerge over time. Examples include:
• Declining Property Crime: Many traditional property crimes have decreased over the past decade.
• Rising Cybercrime: Online scams, identity theft, and digital fraud continue to increase.
• Vehicle Theft Concerns: Motor vehicle theft remains a major concern in several metropolitan areas.
• Fraud Growth: Financial fraud continues to generate significant losses for Texans.
Understanding trends helps identify emerging risks rather than focusing solely on current numbers.
How Crime Statistics Help You
Crime data can help residents:
• Evaluate neighborhood trends
• Understand local risks
• Improve personal safety planning
• Make informed decisions
• Identify emerging threats
Better understand news reports
Statistics become far more useful when viewed as tools for awareness rather than reasons for fear.
Texas Crime Statistics and Cybercrime
One of the most significant shifts in modern crime trends is the rapid rise of cybercrime. While traditional offenses such as burglary, robbery, and motor vehicle theft continue to receive substantial attention, an increasing amount of criminal activity now occurs online, often without any physical contact between offenders and victims.
Texas has emerged as one of the states most heavily impacted by cybercrime, with reported financial losses exceeding over $20.877 billion, representing an increase of approximately 23% amounting to about $16.577 billion from previous year.
These numbers place Texas among the most targeted states in America for cyber-enabled crimes, reflecting both the state’s large population and its growing digital economy.
The Most Common Cybercrimes Affecting Texans
The FBI identified several cybercrime categories that generated the highest number of complaints from Texas residents during 2024:
- Extortion – 7,854 complaints
- Personal Data Breaches – 5,424 complaints
- Phishing and Spoofing Attacks – 3,987 complaints
When measured by financial losses rather than complaint volume, the picture changes considerably.
The costliest cybercrimes reported by Texans were:
| Cybercrime Category | Reported Losses |
| Investment Fraud | $636 Million |
| Business Email Compromise | $293.5 Million |
| Tech Support Scams | $86.7 Million |
These three categories alone accounted for more than $1 billion in reported losses, demonstrating how financially devastating cybercrime has become.
Cybercrime Is Growing Faster Than Traditional Crime
One reason cybercrime deserves special attention is its growth rate. While many traditional property crimes have generally declined over the past decade, cyber-enabled offenses continue to expand.
Nationally, the FBI reported that Americans lost a whooping higher amount than ever before in history, approaching $21 billion, while total complaints surpassed 1 million reports nationwide for the first time.
The rapid growth of online banking, digital payments, cryptocurrency investments, remote work, cloud services, artificial intelligence tools, and social media platforms has created new opportunities for cybercriminals to exploit victims at an unprecedented scale.
Why Cybercrime Often Goes Underreported
Experts believe official statistics likely underestimate the true scale of cybercrime. Many victims:
- Never realize they have been targeted
- Feel embarrassed about reporting scams
- Recover losses privately through financial institutions
- Assume law enforcement cannot help
As a result, actual cybercrime losses are believed to be significantly higher than reported figures.
Why Texans Should Pay Attention

Unlike traditional crimes that may be limited to a specific neighborhood or city, cybercrime can affect anyone with an internet connection. Whether it’s:
- A phishing email
- A fraudulent investment opportunity
- Identity theft
- A ransomware attack
- A fake online marketplace listing
- A business email compromise scheme
Cybercriminals can target victims from anywhere in the world within seconds.
The data highlights an important reality: modern crime is increasingly digital. Understanding cybercrime trends is now just as important as understanding burglary rates, vehicle theft statistics, or violent crime patterns. As Texas continues to grow and become more connected, cybersecurity awareness is becoming an essential component of personal safety, financial security, and crime prevention.
Final Thoughts
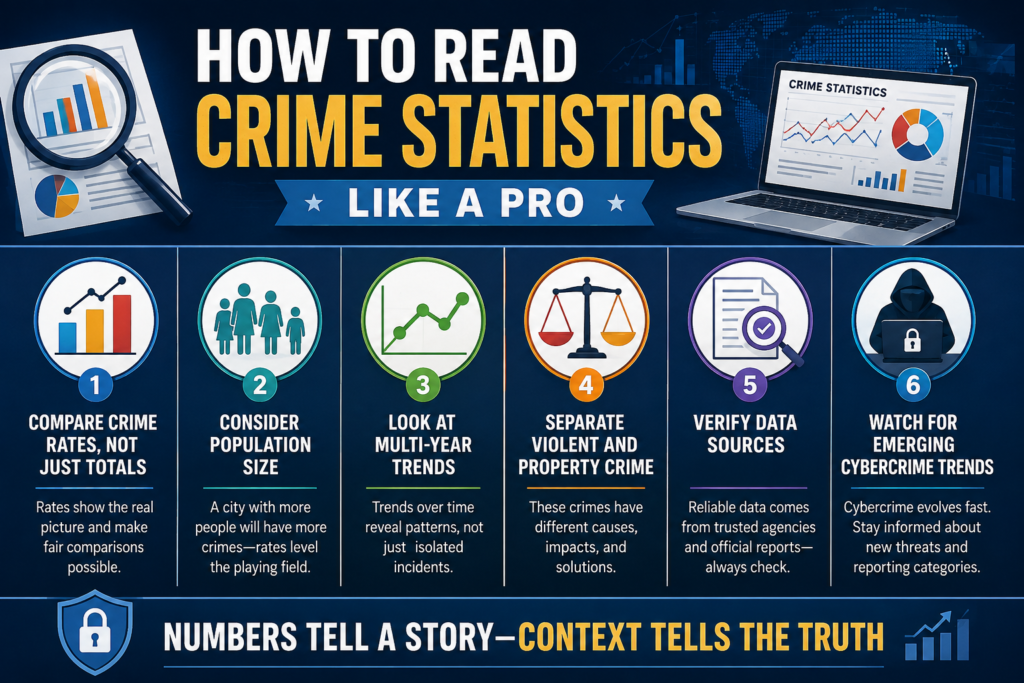
Crime statistics are powerful tools, but only when they are interpreted correctly. Raw numbers, percentages, crime rates, and long-term trends all tell different parts of the story. Without context, statistics can create confusion or exaggerate risks. With context, they become valuable insights that help individuals understand what is actually happening in their communities.
Learning to read crime data like a professional doesn’t require a background in law enforcement or statistics. By focusing on crime rates rather than totals, considering population size, examining long-term trends, and relying on credible sources, anyone can develop a more accurate understanding of public safety issues.
Ultimately, the goal of crime statistics is not to create fear, it is to provide information. When used responsibly, crime data helps communities identify challenges, allocate resources, improve prevention efforts, and make better-informed decisions. The more you understand the numbers, the better equipped you are to separate fact from perception and gain a clearer picture of crime in Texas.